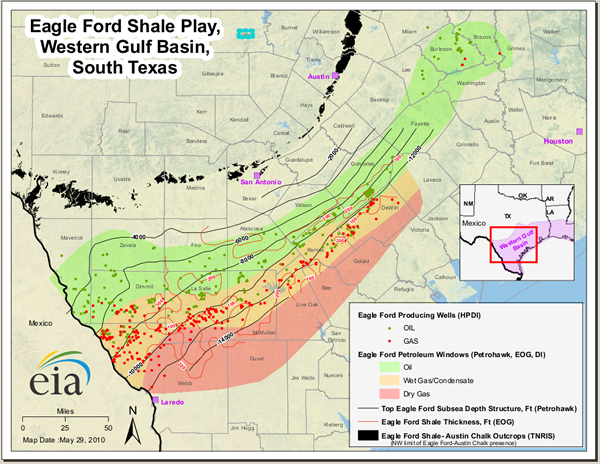
Eagle Ford Shale Formation Map showing oil and natural gas areas as well as wet gas condensate and dry gas. This map is posted courtesy of the EIA.
Producing gas and more oil than traditional shale plays, Eagle Ford went from a mere average of 352 barrels of oil production per day in 2008 to an astounding average of 688,429 barrels per day in 2013. That’s a growth rate of nearly 2000 percent in just five years.
For more see Eagle Ford is Turning Texas into Global Petroleum Powerhouse
This is not an offer to sell nor solicitation of an offer to buy any security. Such offer may only be made by a written prospectus in a jurisdiction wherein the offering is duly registered or exempt therefrom. This content is provided for informational purposes only. Nothing herein shall be construed as tax, legal, or accounting advice. Investing in oil and gas is highly speculative and could result in substantial losses. There are no guarantees that any returns will be achieved. Potential investors should consult their attorney, accountant, and financial advisors before investing in oil and gas.

© Copyright 2026 Aresco, LLC. All rights reserved. | Privacy Policy | Admin Log in
