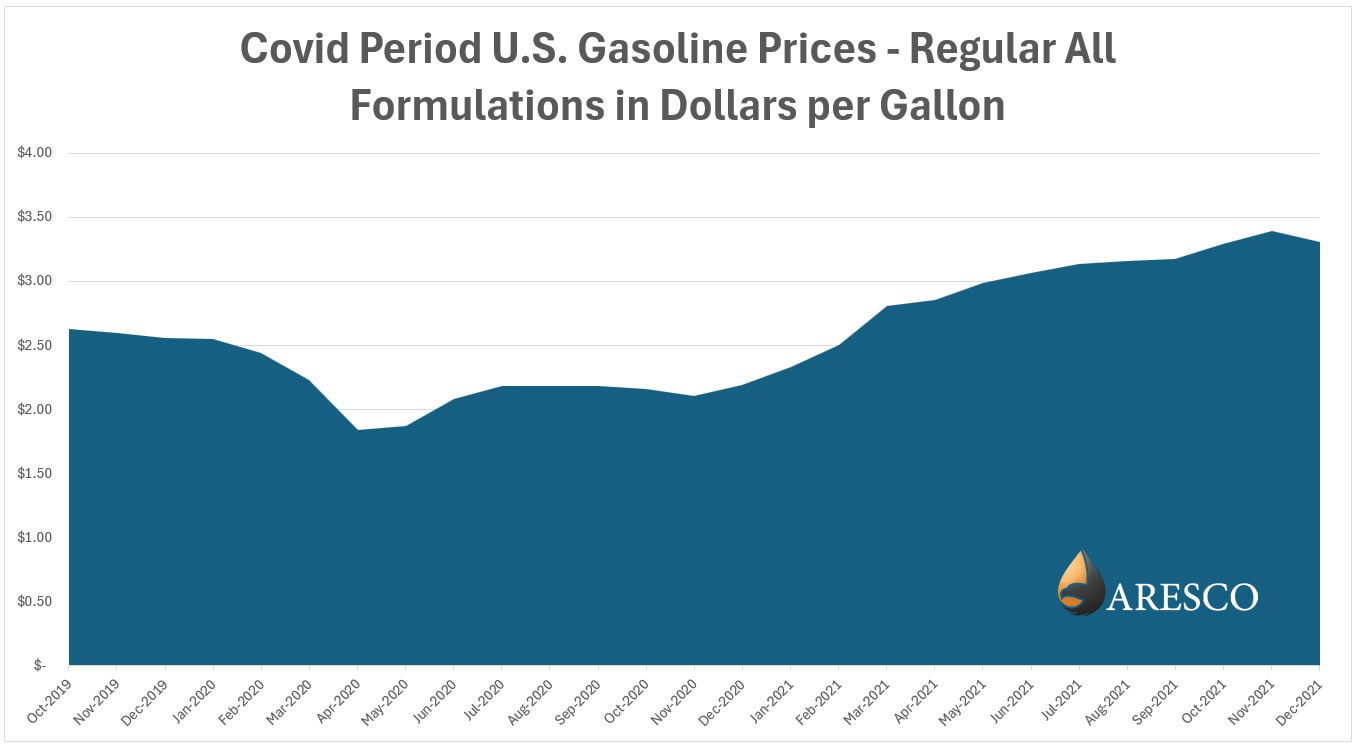
This chart highlights U.S. gasoline prices (regular, all formulations) during the COVID period, spanning late 2019 through the end of 2021, using data from the U.S. Energy Information Administration (EIA). The most striking feature is the sharp decline in prices during the early months of 2020, where gasoline fell from around $2.60 per gallon in late 2019 to below $1.90 by April 2020. This drop reflects the sudden collapse in demand as lockdowns, travel restrictions, and reduced economic activity significantly curtailed fuel consumption across the country.
Following this low point, prices began a gradual but steady recovery throughout the remainder of 2020 as mobility increased and economic activity resumed. By early 2021, gasoline prices had climbed back above $2.20 per gallon and continued rising throughout the year. The upward trend accelerated in the spring and summer of 2021, driven by rebounding demand, tightening supply, and broader energy market dynamics, ultimately reaching the mid-$3.00 range by late 2021.
Overall, the chart illustrates a classic demand shock followed by recovery: a rapid decline caused by unprecedented global conditions, followed by a sustained rebound as markets normalized. It underscores how sensitive gasoline prices are to sudden shifts in economic activity and how quickly they can recover once demand returns.
Return to blog Understanding U.S. Gasoline Gasoline Price Spikes 2015 -2026
This is not an offer to sell nor solicitation of an offer to buy any security. Such offer may only be made by a written prospectus in a jurisdiction wherein the offering is duly registered or exempt therefrom. This content is provided for informational purposes only. Nothing herein shall be construed as tax, legal, or accounting advice. Investing in oil and gas is highly speculative and could result in substantial losses. There are no guarantees that any returns will be achieved. Potential investors should consult their attorney, accountant, and financial advisors before investing in oil and gas.

© Copyright 2026 Aresco, LLC. All rights reserved. | Privacy Policy | Admin Log in
