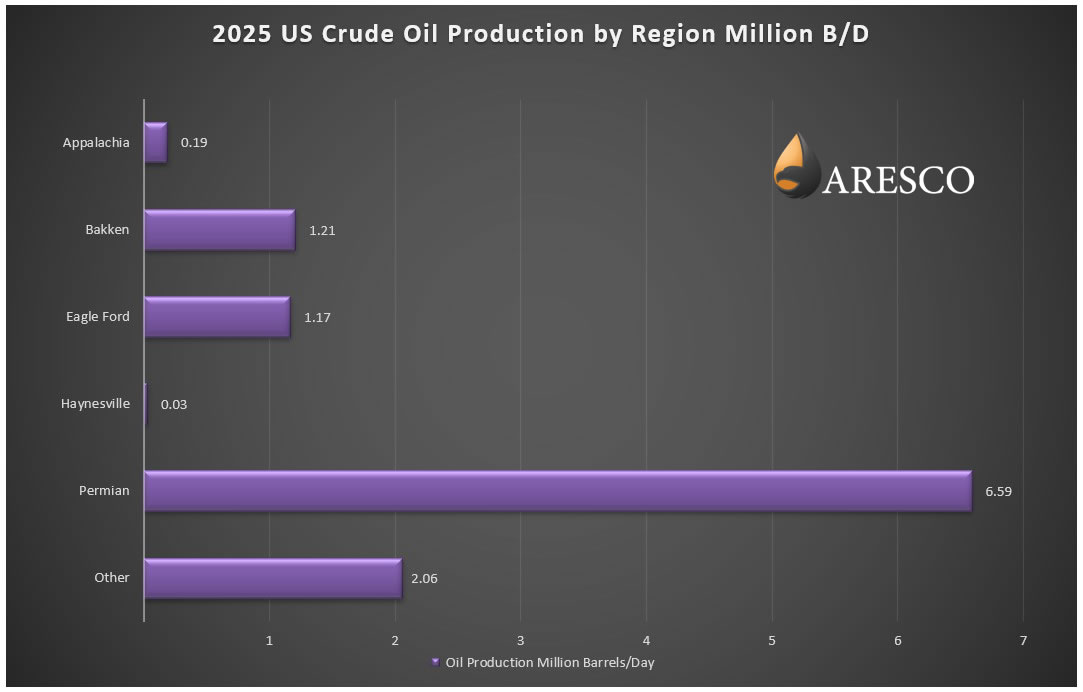
The US Crude Oil Production Chart for 2025, based on data from the U.S. Energy Information Administration (EIA), illustrates how total U.S. oil output is distributed across the major producing regions of the country. The chart shows production in million barrels per day (MMbbl/d) and highlights the dominant role of the Permian Basin while also showing contributions from the Eagle Ford, Bakken, Appalachia, Haynesville, and other producing regions.
This US Crude Oil Production Chart provides a clear visual breakdown of where oil production is coming from geographically and demonstrates how a few key basins account for the majority of total U.S. output. The data also reflects the continued growth of shale production and the importance of unconventional drilling technologies in maintaining record production levels.
________________________________________
Region – Production (MMbbl/d)
Permian – 6.59
Eagle Ford – 1.17
Bakken – 1.21
Appalachia – 0.19
Haynesville – 0.03
Other – 2.06
Total production represented in this US Crude Oil Production Chart equals approximately 11.25 million barrels per day across the listed regions, with the Permian Basin alone accounting for well over half of the output shown in the chart.
________________________________________
The most striking feature of the US Crude Oil Production Chart is the overwhelming dominance of the Permian Basin, which produces 6.59 million barrels per day in 2025. This makes the Permian not only the largest producing region in the United States but also one of the most productive oil fields in the world.
Located primarily in West Texas and southeastern New Mexico, the Permian Basin has seen rapid growth over the past decade due to advances in horizontal drilling and hydraulic fracturing. The chart clearly shows that production from the Permian alone exceeds the combined output of several other basins, highlighting its critical role in total U.S. supply.
Because of its size, resource depth, and favorable economics, the Permian Basin continues to be the primary driver of increases shown in the US Crude Oil Production Chart.
________________________________________
The US Crude Oil Production Chart also shows strong output from the Bakken and Eagle Ford regions, which remain two of the most important shale plays in the United States.
The Bakken, located mainly in North Dakota and Montana, produced 1.21 million barrels per day in 2025. Although production growth in the Bakken has slowed compared to earlier years, it remains one of the top-producing regions in the country.
The Eagle Ford, located in South Texas, produces 1.17 million barrels per day, making it another key contributor in the chart. The Eagle Ford has maintained steady production due to continued drilling activity and improved well efficiency.
Together, these two basins account for more than 2 million barrels per day in the US Crude Oil Production Chart, reinforcing their importance in overall U.S. energy production.
________________________________________
Smaller but still significant contributions in the US Crude Oil Production Chart come from Appalachia, Haynesville, and the category labeled “Other.”
Appalachia produces 0.19 million barrels per day, reflecting modest oil production in a region better known for natural gas output. The Haynesville region contributes 0.03 million barrels per day, which is relatively small for crude oil but included in the chart for completeness.
The “Other” category accounts for 2.06 million barrels per day, representing production from multiple smaller basins across the United States, including legacy conventional fields, and emerging shale areas. This portion of the US Crude Oil Production Chart shows that while a few basins dominate, a large amount of production still comes from a wide variety of locations.
________________________________________
This US Crude Oil Production Chart highlights several important trends in the U.S. oil and gas industry:
• The Permian Basin is the largest source of U.S. crude oil by a wide margin
• Shale basins continue to dominate total production
• Multiple regions contribute to overall supply, improving energy security
• Total production remains strong due to technological advancements
• Output is concentrated but still diversified geographically
The chart demonstrates that U.S. production strength comes from both high-volume shale plays and a broad network of smaller producing regions.
________________________________________
The US Crude Oil Production Chart for 2025, based on EIA data, provides a clear picture of how oil production is distributed across the United States. With 6.59 million barrels per day, the Permian Basin leads by a wide margin, followed by the Bakken, Eagle Ford, and a collection of other producing regions that together make up the rest of U.S. output.
This regional breakdown shown in the US Crude Oil Production Chart illustrates the importance of shale development, technological innovation, and geographic diversity in maintaining high production levels. As the chart demonstrates, U.S. crude oil output remains strong in 2025, supported by multiple basins but driven primarily by the continued growth of the Permian Basin.
Return to Aresco’s Oil & Gas Resources page.
This is not an offer to sell nor solicitation of an offer to buy any security. Such offer may only be made by a written prospectus in a jurisdiction wherein the offering is duly registered or exempt therefrom. This content is provided for informational purposes only. Nothing herein shall be construed as tax, legal, or accounting advice. Investing in oil and gas is highly speculative and could result in substantial losses. There are no guarantees that any returns will be achieved. Potential investors should consult their attorney, accountant, and financial advisors before investing in oil and gas.

© Copyright 2026 Aresco, LLC. All rights reserved. | Privacy Policy | Admin Log in
