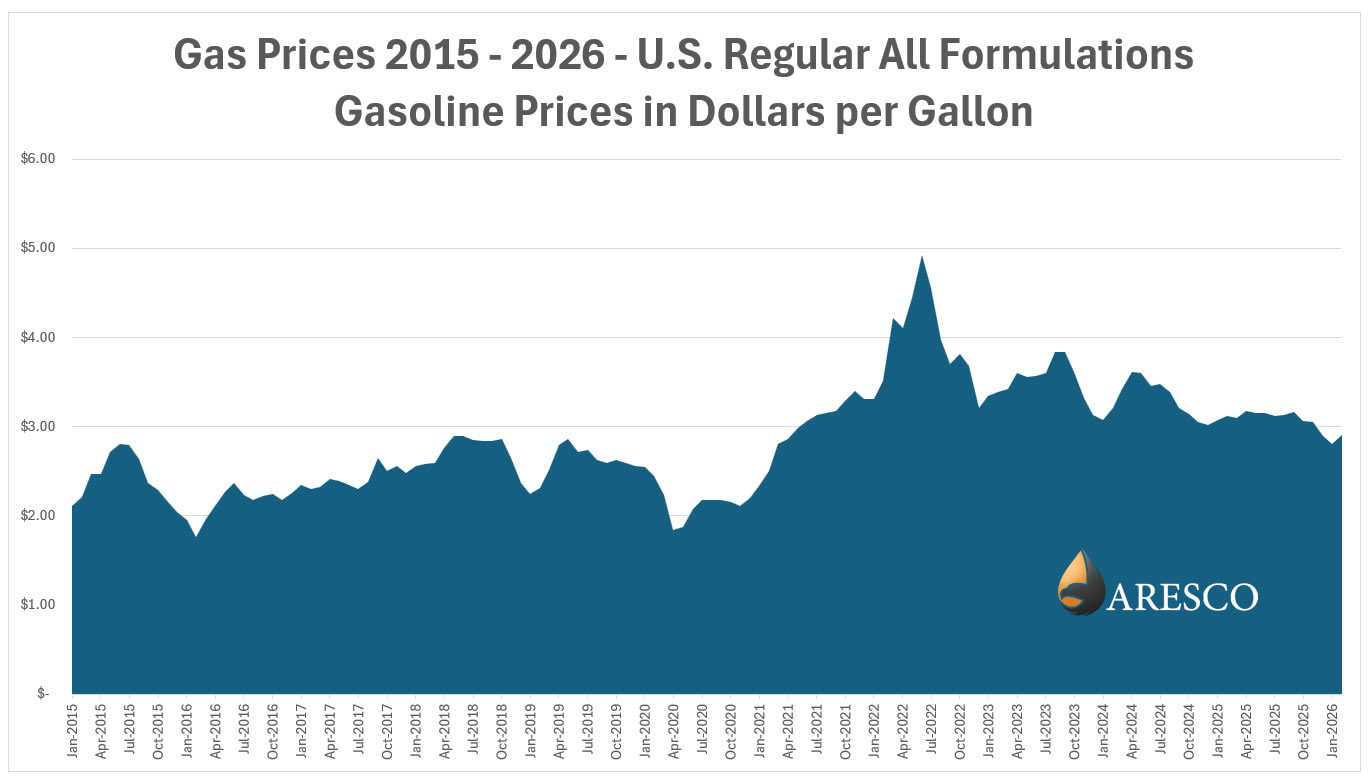
The chart illustrates monthly U.S. gasoline prices (regular, all formulations) from January 2015 through early 2026, based on data from the U.S. Energy Information Administration (EIA). Over this period, prices show clear cyclical patterns driven by market dynamics, seasonal demand, and global events. Gasoline prices began near $2.10 per gallon in early 2015, rose to nearly $2.80 by mid-2015, and then declined into 2016, reflecting broader weakness in crude oil markets. From 2017 through 2019, prices stabilized in a moderate range between roughly $2.20 and $2.90 per gallon, with typical seasonal increases during summer driving months.
A sharp decline is visible in early 2020, where prices fell below $2.00 per gallon due to reduced demand during the global economic slowdown. This downturn was followed by a strong recovery beginning in 2021, as demand rebounded and supply constraints tightened. The most significant spike occurs in 2022, where gasoline prices surged to nearly $5.00 per gallon—an unprecedented high during the timeframe—driven by global supply disruptions and geopolitical tensions. Following this peak, prices declined but remained elevated compared to pre-2021 levels, generally ranging between $3.00 and $3.80 through 2023 and 2024.
In 2025 and into early 2026, gasoline prices appear to stabilize in the upper-$2.80 to low-$3.20 range, suggesting a normalization of market conditions while still reflecting a higher baseline than much of the previous decade. Overall, the chart highlights how U.S. gasoline prices are highly responsive to both domestic supply-demand fundamentals and global geopolitical influences, with sharp spikes typically followed by gradual corrections.
Return to the blog, Understanding U.S. Gasoline Price Spikes 2015-2026
This is not an offer to sell nor solicitation of an offer to buy any security. Such offer may only be made by a written prospectus in a jurisdiction wherein the offering is duly registered or exempt therefrom. This content is provided for informational purposes only. Nothing herein shall be construed as tax, legal, or accounting advice. Investing in oil and gas is highly speculative and could result in substantial losses. There are no guarantees that any returns will be achieved. Potential investors should consult their attorney, accountant, and financial advisors before investing in oil and gas.

© Copyright 2026 Aresco, LLC. All rights reserved. | Privacy Policy | Admin Log in
