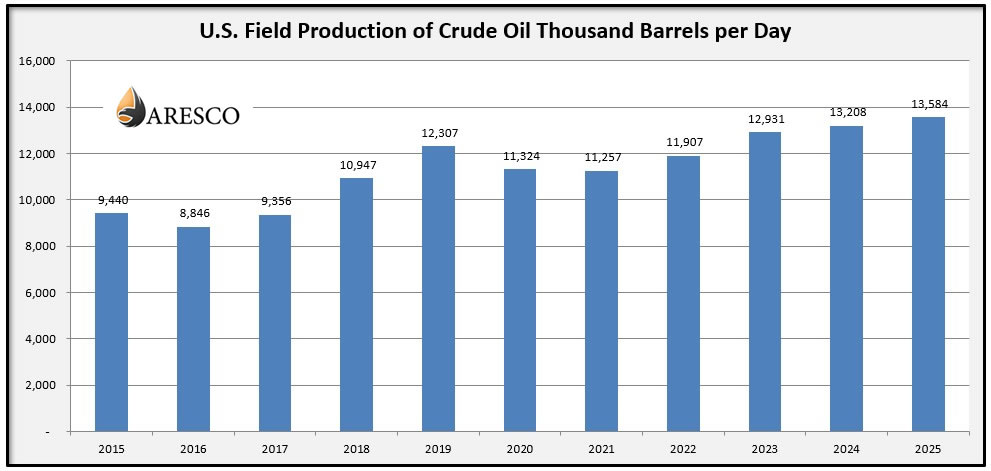
This chart illustrating US Crude Oil Production from 2015 through 2025, based on data from the U.S. Energy Information Administration (EIA), shows a clear long-term upward trend with a temporary decline during the pandemic years followed by strong recovery and record-setting output. The data is presented in thousand barrels per day, providing a clear visual representation of how U.S. field production has expanded over the past decade and how technological advances, increased drilling activity, and strong global demand have contributed to rising production levels.
From 2015 to 2025, US Crude Oil Production increased from 9,440 thousand barrels per day to 13,584 thousand barrels per day, representing one of the most significant production expansions in modern U.S. energy history. The chart highlights the resilience of the U.S. oil industry, showing that even after a sharp decline in 2020, production rebounded and moved to new all-time highs by 2024 and 2025.
________________________________________
Year – US Crude Oil Production
2015 – 9,440
2016 – 8,846
2017 – 9,356
2018 – 10,947
2019 – 12,307
2020 – 11,324
2021 – 11,257
2022 – 11,907
2023 – 12,931
2024 – 13,208
2025 – 13,584
________________________________________
The chart shows that US Crude Oil Production declined slightly from 2015 to 2016, falling from 9,440 to 8,846 thousand barrels per day. This drop was largely due to lower oil prices during that period, which reduced drilling activity across major shale basins.
Production began to recover in 2017, rising to 9,356 thousand barrels per day, as improved drilling efficiency, horizontal drilling, and hydraulic fracturing technologies allowed producers to increase output while controlling costs. This marked the beginning of a rapid expansion phase that would continue through the end of the decade.
By 2018, US Crude Oil Production surged to 10,947 thousand barrels per day, and in 2019 it reached 12,307 thousand barrels per day, reflecting strong activity in key regions such as the Permian Basin, Eagle Ford, and Bakken formations. The chart clearly shows this steep upward slope, illustrating how the United States became the world’s leading oil producer during this time.
________________________________________
One of the most noticeable features of this chart is the dip in US Crude Oil Production during 2020 and 2021. Production fell from 12,307 thousand barrels per day in 2019 to 11,324 in 2020, followed by a slight decrease to 11,257 in 2021.
This decline corresponds with the global slowdown in energy demand during the COVID-19 pandemic, when travel restrictions, reduced industrial activity, and lower fuel consumption caused oil prices to fall sharply. As a result, many drilling projects were paused or delayed, which is reflected in the temporary drop shown in the chart.
Despite this setback, the decline was short-lived compared to historical downturns, demonstrating the flexibility of the modern U.S. oil industry.
________________________________________
Beginning in 2022, the chart shows a strong rebound in US Crude Oil Production, rising to 11,907 thousand barrels per day as demand returned and drilling activity increased. The upward trend continued in 2023, when production reached 12,931 thousand barrels per day.
The chart reaches its highest levels in 2024 and 2025, with production climbing to 13,208 and then 13,584 thousand barrels per day respectively. These figures represent the highest production levels ever recorded, confirming the United States’ position as the top crude oil producer in the world.
This portion of the chart highlights the long-term growth trend in US Crude Oil Production, showing that even after economic disruptions, production continued to expand due to technological innovation, improved efficiency, and strong global demand for petroleum.
________________________________________
Overall, this chart provides a clear visual summary of how US Crude Oil Production has evolved over the past decade. Key takeaways visible in the image include:
• A temporary decline in 2016 due to lower oil prices
• Rapid growth from 2017 through 2019
• A short-term drop during the 2020–2021 pandemic period
• A strong recovery beginning in 2022
• Record production levels in 2024 and 2025
The chart demonstrates the strength and adaptability of the U.S. oil and gas sector, showing that production continues to grow even after major global disruptions.
________________________________________
The US Crude Oil Production chart from 2015 through 2025 clearly illustrates one of the most important trends in modern energy history: the steady rise of U.S. oil output to record levels. Using data from the EIA, the image shows how production expanded from under 9.5 million barrels per day to more than 13.5 million barrels per day in just ten years.
This long-term growth trend highlights the impact of technological innovation, increased drilling efficiency, and strong demand for energy. As shown in the chart, US Crude Oil Production not only recovered after the 2020 downturn but went on to reach new highs, reinforcing the United States’ role as the world’s leading crude oil producer.
Return to Aresco’s Oil & Gas Resources page.
This is not an offer to sell nor solicitation of an offer to buy any security. Such offer may only be made by a written prospectus in a jurisdiction wherein the offering is duly registered or exempt therefrom. This content is provided for informational purposes only. Nothing herein shall be construed as tax, legal, or accounting advice. Investing in oil and gas is highly speculative and could result in substantial losses. There are no guarantees that any returns will be achieved. Potential investors should consult their attorney, accountant, and financial advisors before investing in oil and gas.

© Copyright 2026 Aresco, LLC. All rights reserved. | Privacy Policy | Admin Log in
