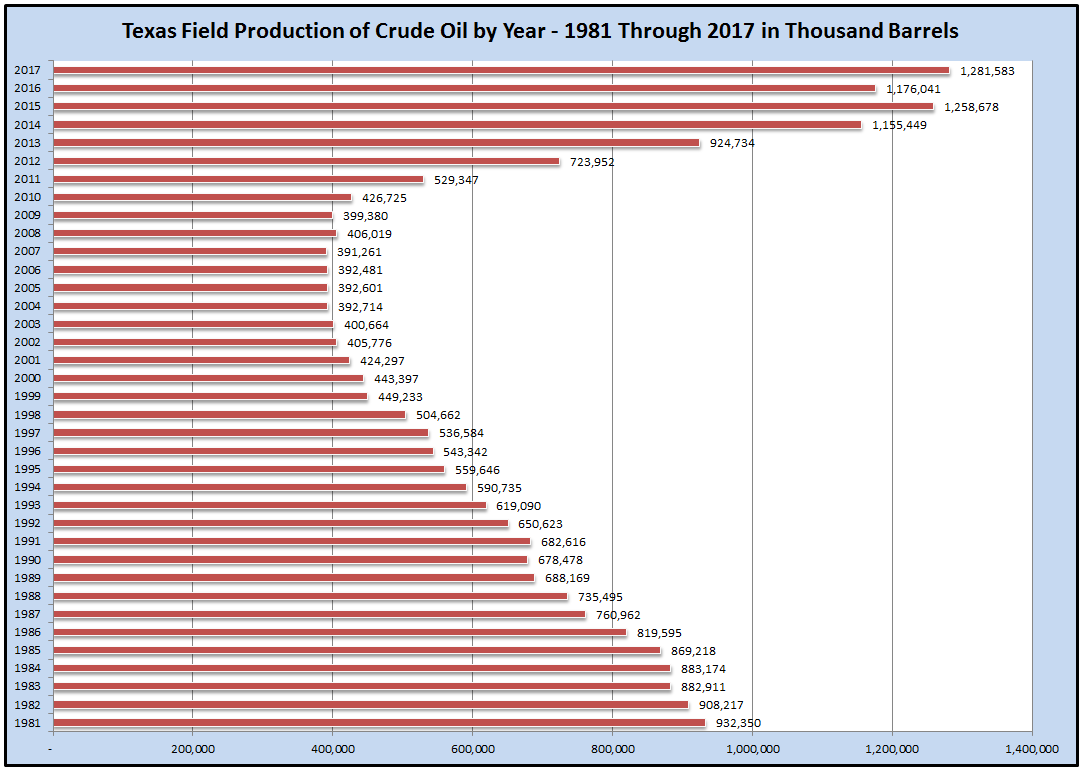
This chart depicts Texas field production of crude oil by year in thousand barrels. The date range is from 1981 through 2017.
Year Texas Field Production of Crude Oil Thousand Barrels
1981 932,350
1982 908,217
1983 882,911
1984 883,174
1985 869,218
1986 819,595
1987 760,962
1988 735,495
1989 688,169
1990 678,478
1991 682,616
1992 650,623
1993 619,090
1994 590,735
1995 559,646
1996 543,342
1997 536,584
1998 504,662
1999 449,233
2000 443,397
2001 424,297
2002 405,776
2003 400,664
2004 392,714
2005 392,601
2006 392,481
2007 391,261
2008 406,019
2009 399,380
2010 426,725
2011 529,347
2012 723,952
2013 924,734
2014 1,155,449
2015 1,258,678
2016 1,176,041
2017 1,281,583
More Oil & Gas Resources
This is not an offer to sell nor solicitation of an offer to buy any security. Such offer may only be made by a written prospectus in a jurisdiction wherein the offering is duly registered or exempt therefrom. This content is provided for informational purposes only. Nothing herein shall be construed as tax, legal, or accounting advice. Investing in oil and gas is highly speculative and could result in substantial losses. There are no guarantees that any returns will be achieved. Potential investors should consult their attorney, accountant, and financial advisors before investing in oil and gas.

© Copyright 2024 Aresco, LP. All rights reserved. | Privacy Policy | Site by A3K Marketing. Admin Log in
